Mapping the New Politics of Care
A joint initiative between GSAPP’s Center for Spatial Research and Yale’s Global Health Justice Partnership redefines what constitutes a community in need in the COVID era.

Mapping the New Politics of Care, a cross-disciplinary initiative of Columbia and Yale, has a bold plan to address the longstanding inequalities in this country exacerbated by the pandemic: the deployment of one million health care workers to respond to the needs of people across the United States as part of "a New Deal" for public health.
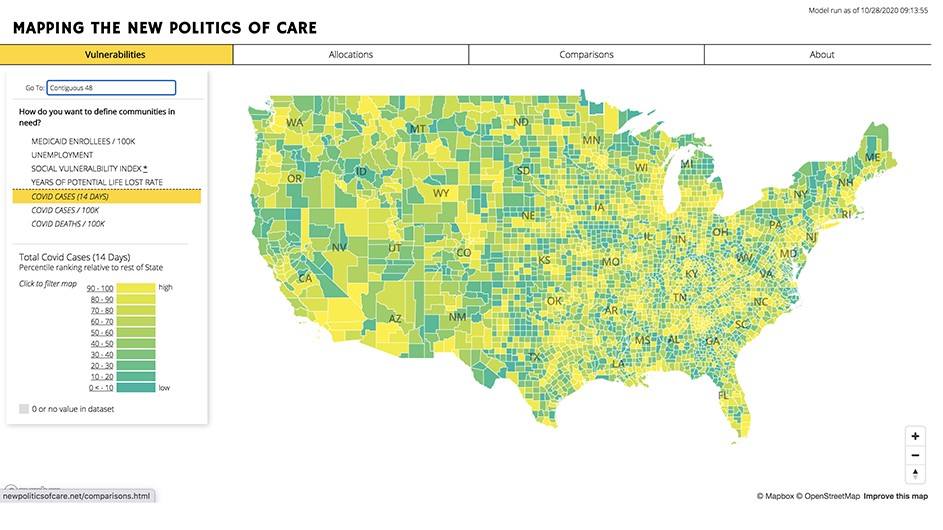
The project, launched in May by a team of researchers from the Graduate School of Architecture, Planning, and Preservation's Center for Spatial Research and Yale’s Global Health Justice Partnership, not only reveals county-level variations in vulnerability indexes and COVID-19 data across the United States, but also visualizes the impact of each dataset on the geographic allocation of public health resources. Simulating this vision as a real-world scenario, the website queries each user on what factors should be used to define a community in need and, consequently, prioritized in terms of access to public health resources.
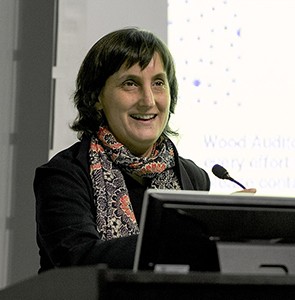
Laura Kurgan, a GSAPP professor and director of the Center for Spatial Research sees the initiative as a refreshingly different, more personal approach to typical COVID-19 diagrams flooding the media. “It was important to show how vulnerability shapes the country we live in,” Kurgan said. “COVID-19 is only the most current crisis facing cities and towns across the country; here we can show you where vulnerabilities existed long before the pandemic hit.”

A Community Health Corps
During the height of the initial COVID-19 surge in April, Kurgan read a series of essays in the Boston Review. One of them, titled “The New Politics of Care,” proposed a Community Health Corps as an "actual solution, one place to start to build a new movement that heals us and our body politic.”
The essays were co-authored by Gregg Gonsalves, a Yale School of Public Health professor and codirector of the Global Health Justice Partnership, and Amy Kapczynski, a Yale Law School professor and faculty director of the Global Health Justice Partnership.
For Kurgan, their words and analyses illuminated a starting point for a map project she was eager to co-direct with Gonsalves: “His attitude about health and care has always pushed boundaries,” said Kurgan, “and reminded me and everyone else that lives are at stake in this research.”
The scholarly admiration is mutual. “Kurgan's and the Center for Spatial Research’s ability to talk about social and economic issues in a way that uses visualization and graphic design to explain and explore,” Gonsalves said, “brings a vibrancy and a new understanding to these topics that you simply can’t get from the written word alone.”
The Complexity of Vulnerability
The first step in using the map is ticking off checkboxes for seven measures that help to define a community in need: Medicaid enrollees, unemployment, social vulnerability index, years of potential life lost rate, COVID cases in the past 14 days, COVID cases per 100,000 residents, and COVID deaths per 100,000 residents.
The map immediately clarifies that vulnerability is a complex, multilayered issue, which is impossible to pinpoint with a single dataset. During the time that this article was written, New York City’s five boroughs, for example, shared the lowest level of vulnerability (and would, therefore, be allotted the lowest number of community health workers) based on the number of COVID cases per 100,000 residents over the past 14 days.
Conversely, all five boroughs displayed the highest levels of vulnerability, according to both unemployment data and the social vulnerability index, a composite score of social factors published by the Centers for Disease Control and Prevention (CDC). New York City’s vulnerability rates were divided across the spectrum, according to Medicaid enrollment data, with Manhattan at a medium level, Richmond Hill in Queens slightly lower, and Bronx, Queens, and Kings counties ranking at the highest level (more information on each dataset can be found here).
Networks of Care: Design in Action
The project already has proven to be an important resource for GSAPP students. Over the summer, six of them employed as research assistants at the Center for Spatial Research used the platform to critically question the role of mapping and data visualization in interpreting the pandemic by zooming into sites across the country and investigating patterns in COVID’s spread. The researchers’ methods of data analysis were then shared with students enrolled in Kurgan’s advanced architecture studio, “Networks of Care: Design in Action” (in which Gonsalves has played a key role).
These students, who are participating in the online course on a hybrid basis from New York, China, and Peru, are exploring topics that range from the social impact of Amazon warehouse locations to COVID-induced homelessness. “All of these dimensions of the pandemic,” Kurgan said, “might be missed by a standard infection and death rate accounting of COVID. The map, with its multiple layers of social vulnerability, can help redirect resources to underserved communities.”
In addition to architects, planners, and designers, Mapping the New Politics of Care envisions journalists, senior-level policymakers (in and beyond the health care sector), ground-level health care providers, scholars, analysts, activists, and social justice-oriented data visualization practitioners among potential users, as well as the general public.
“I hope that this project gets viewed by those with a specific interest in the issues we’re raising: vulnerability in the context of COVID and the vulnerabilities that long preceded the pandemic,” Gonsalves said. “We’re telling a story of where people live—their states, their counties. For me, this is part of citizen science. Anyone can use this tool to explore what it means to be vulnerable in 2020 at the state and local level.”
In addition to Gonsalves and Kurgan, the project team includes Dare Brawley, assistant director of the Center for Spatial Research; Jia Zhang, Mellon associate research scholar at the Center for Spatial Research; Suzan Iloglu, postdoctoral research associate at Yale School of Public Health; Thomas Thornhill, a Yale research assistant; Adeline Chum, a GSAPP research assistant; and Nelson De Jesus Ubri, another GSAPP research assistant.
“We hope that our research and visualization methods,” Kurgan said, “will outlast the present emergency.”
Shannon Werle is the digital editor in the communications office at GSAPP.