A Career Spent Collecting Earth’s Seismic Clues
Professor Göran Ekström tracks incidents like landslides and glacier collapse using tools once used only to monitor earthquakes.
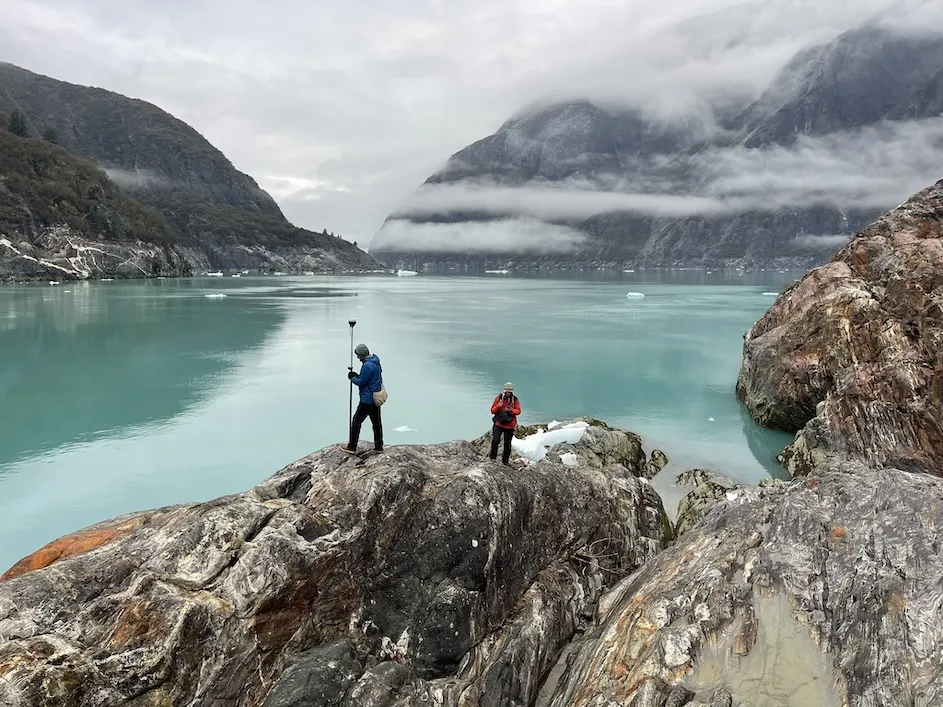
In the summer of 2025, a massive rock slope collapsed into the Tracy Arm fjord in southeast Alaska, causing a tsunami that sent water more than 1,500 feet up the fjord’s steep walls. No tourists were present in the fjord at the time, but they could have been: Cruise ships regularly conduct sightseeing tours there.
Göran Ekström is Newberry Professor of Earth and Environmental Sciences within the Faculty of Arts and Sciences, and a professor at Lamont-Doherty Earth Observatory, which is part of the Columbia Climate School. With colleagues from several institutions, he recently published research in the journal Science on the tsunami, why it happened, and what it means for future climate risk mitigation. Columbia News spoke to him about the paper’s findings, and his path to tracking landslides like this one around the world.
How would you describe what happened in the Tracy Arm fjord?
It was an outrageous event. Imagine a very steep-walled fjord, carved by a glacier. One whole side of that fjord, this huge rock slope, collapses into the water. When that mass hits, it pushes water up the opposite wall to extraordinary heights. Then the water falls back down, surges again up the other side, and sloshes back and forth down the fjord.
The wave was still high all the way down the fjord, and it left a visible scar where it stripped away big trees along the slopes. You can walk or fly along those walls and see the line where the forest used to be. It would not have been good to be there with a cruise ship carrying a thousand people.
Are events like this becoming more likely as the climate warms?
Yes. The simplest way to think about this is that ice buttresses the mountainsides. Glaciers carve these deep, steep valleys and fill them with ice. While the ice is there, it helps support those very steep walls.
As the glaciers retreat, the ice pulls back and leaves behind extremely steep rock slopes. Those slopes are gravitationally unstable. If there are fractures, if the rock is weakened, they can fail catastrophically, as we saw in Tracy Arm.
If this particular landslide had happened twenty years earlier, the glacier would have extended farther down the fjord, and the rock would have come down onto ice rather than into water. You would still have had a landslide, but not a tsunami. Glacier retreat is changing the consequences of landslides.
What was your contribution to the Tracy Arm research?
My role is the seismology. When this event happened, people in the region saw the wave and realized something dramatic must have occurred. Very quickly, with modern satellite imagery, they could see the fresh landslide scar at the head of the fjord.
At that point they called me and asked: “Do you see this in the seismic records?” A landslide of this size makes signals that look a little like an earthquake, but not exactly—they have a characteristic shape. We see them on seismometers all around the world.
I’ve spent about fifteen to twenty years developing ways to detect these non-earthquake events in global seismic data. I can confirm that something big happened at a given time and place, and then I can estimate how much rock moved, its mass and volume, and even the direction in which the landslide traveled. For Tracy Arm, we estimated a mass on the order of 200 million tons, and a seismic magnitude of about 5.4, which is large for a landslide, though not among the very largest in absolute volume.
Where does that global seismic data come from? Who runs all these instruments?
There’s a remarkable tradition of data sharing in seismology. The global backbone is made up of instruments funded by agencies like the U.S. National Science Foundation and operated through consortia, plus the U.S. Geological Survey’s global network. France, Germany, and other countries operate their own near-global networks as well.
On top of that, you have dense regional networks run by national or provincial agencies. In western North America, there’s roughly a seismometer every hundred miles or so. For our global earthquake work, we’re continuously collecting data from these stations, and the data are openly available. When something like Tracy Arm happens, we can quickly pull the relevant records from both the global and local networks to get a detailed picture of the event.
Your colleague made animations of the event. What do they show?
Those were made by my colleague Pat Lynett at University of Southern California. He does numerical modeling of waves, so he took the geometry of the fjord and our estimates of how much rock moved and how fast, and simulated how the water would respond.
The animations give you this almost shocking, visceral perspective on the event—the rock collapse, the wall of water surging up the fjord walls, and the wave propagating down-fjord. They make it very clear why this is not just a spectacular curiosity; it’s a real hazard, especially in places where cruise ships are going in to look at the fronts of retreating glaciers.
In one video, he simulated what it would have been like to be on a jet ski trying to escape the tsunami. Even going 70 miles an hour, you would not have been able to outrun it.
How did you get into this field?
I started out squarely in global seismology, characterizing earthquakes and working on monitoring underground nuclear explosions. There was a lot of federal money available for this during the Cold War because the government was interested in learning about where nuclear testing was happening, and seismology can detect nuclear tests, including tests that are happening underground.
About twenty years ago, I became curious about what else might be visible in the seismic data if we looked at it a bit differently. We built a detector that could scan for unusual signals. Suddenly we started seeing strange events in unexpected places: giant calving events from the Greenland ice sheet, unusual signals from volcanoes that were collapsing rather than just erupting, and then these massive landslides.
So now I work in environmental seismology—using the same global infrastructure and analytical tools, but to study ice loss, mass wasting, and other processes tied to climate and surface change.
How did you first learn about the recent devastating floods in Nepal, and how did you get involved in finding their causes?
A landslide colleague alerted me to the flooding disaster early in the morning. I checked the output of the computer algorithm that we run at the Lamont-Doherty Earth Observatory to detect seismic events worldwide using data from the Global Seismographic Network, a collection of about 200 worldwide seismometers, I saw that we had detected and located a huge landslide a few minutes before the flooding. I joined a slack channel created by a group of international colleagues to share findings and discuss. Initial reports of what had happened suggested that this was a glacier collapse, but our analysis instead indicated that this was something much bigger than that. Satellite imagery has since confirmed that the main event was an enormous rock landslide, and the glacier was a small part of it. While erosion and landslides are a natural part of the building of steep mountains like the Himalayas, global warming and glacier melting make the mountain sides more unstable, causing landslides like this one to occur more frequently. With more people and more infrastructure in the river valleys, it is essential to develop effective warning systems to reduce vulnerability.
Early in your career you worked in the USSR. What were you investigating, and how did you end up there?
I’m Swedish, and I trained as a Russian interpreter-interrogator during my compulsory military service. That experience left me fascinated by the language and by Soviet culture, so, after college, I won a Swedish scholarship to spend a year in the USSR. That was just as I was starting to get interested in geophysics, and my first graduate training in seismology was actually at Moscow State University.
Ten years later, in 1991, that Russian background suddenly became very useful. The Soviet Union was beginning to collapse, and there was an opportunity to visit one of their “secret” seismological stations in Kazakhstan, which was central to their nuclear-test monitoring. I went there with my Columbia postdoc adviser and colleague Paul Richards in the final days of the Soviet Union, and my Russian came in very handy for navigating the visit and working with our counterparts. It ended up being a moment where my early Russian training and my seismology work came together in the context of nuclear monitoring and U.S.–Soviet scientific exchange. I remain engaged in research related to the effects and monitoring of nuclear-weapon tests.